
Adoption Analytics (M365, Teams & Copilot) in Power BI / Fabric

Leader-ready dashboards that show whether Teams and Copilot are actually working.

You are investing in Teams and Copilot; can you prove it is working? In 2 to 6 weeks, CloudWay builds adoption analytics for Microsoft 365 in Power BI and Microsoft Fabric: a KPI set for your scenarios, usage signals connected into one model, and dashboards leaders can read, so scale and investment decisions rest on evidence. 

This service pairs naturally with our Adoption & Continuous Improvement: one measures the change, the other drives it. 

The challenge

Organisations are spending heavily on Copilot licences and Teams transformation, and most cannot answer the board’s simplest question: is it working? Native usage reports show clicks, not behaviour change, and without a real analytics model, Copilot ROI is asserted rather than demonstrated.

Adoption is unclear

Usage is happening, but it is hard to see who is adopting what and where.

Behaviour change is unclear

Teams need clearer signals to see whether new ways of working are taking hold.

Impact becomes guesswork

Without evidence, it is harder to connect adoption activity to business outcomes.
What we do

CloudWay builds a practical adoption analytics model from your usage signals. We define the KPI set for your Teams and Copilot scenarios, connect the signals from Microsoft 365 into one model in Power BI or Microsoft Fabric, and publish dashboards designed for leaders and champions rather than analysts. We set up a repeatable refresh and reporting cadence, and can embed the dashboards directly in Teams, so the people driving adoption see the evidence where they already work. 

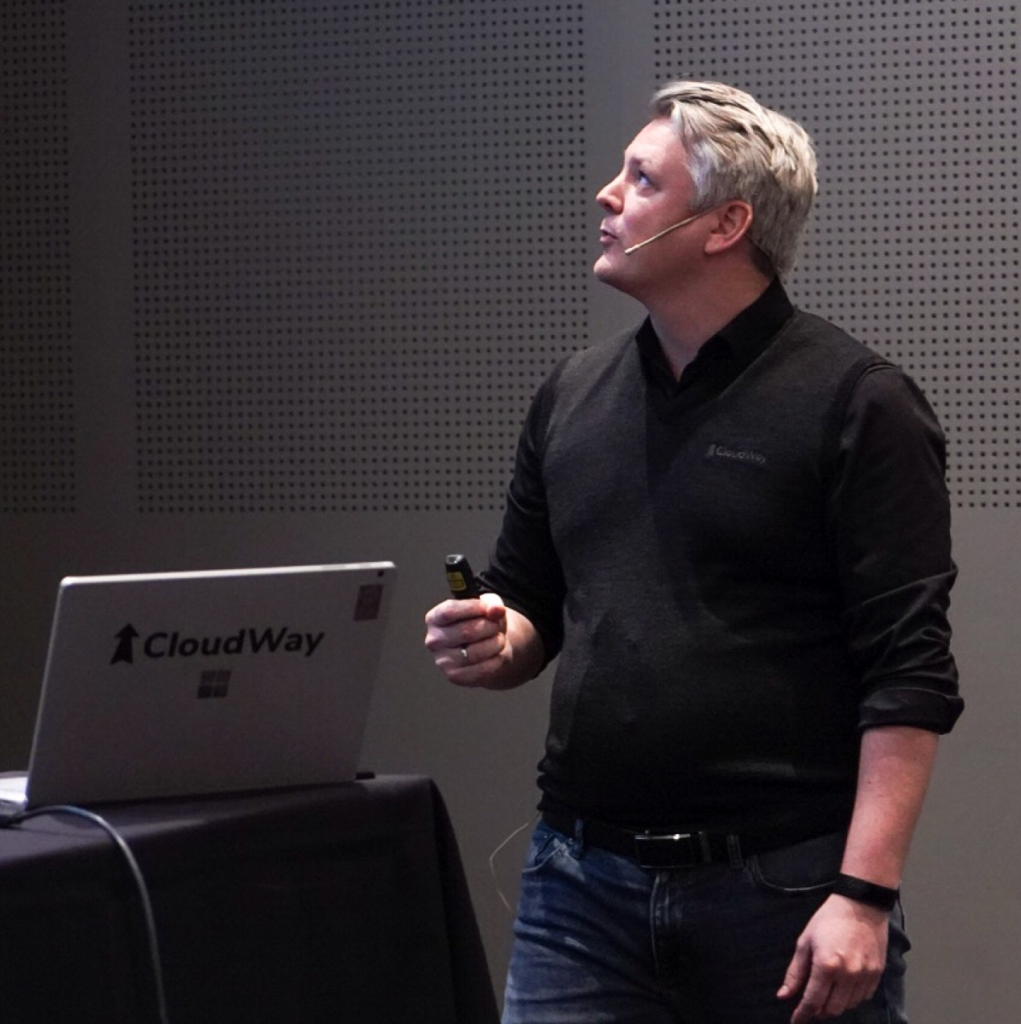
cloudway speaker
Step 1

Build the analytics model

Create a practical model for measuring adoption across Teams and Copilot scenarios.

Step 2

Connect usage signals

Bring together the signals needed to understand adoption, behaviour and impact.

Step 3

Publish Power BI dashboards

Provide leader-ready dashboards for visibility into adoption performance.

Step 4

Enable access and action

Optionally embed dashboards in Teams so decisions can be made from evidence.

You get

Typical outcomes

Adoption KPI set (Teams and Copilot scenarios)

You get a KPI set defined for your specific Teams and Copilot scenarios, not generic usage counts.

Visibility into what’s working and what’s not

You see which groups and scenarios show real change, and which do not.

chart-line

Dashboards for leaders and champions

You get Power BI dashboards readable in two minutes without an analyst translating, embeddable directly in Teams.

Better prioritisation of adoption actions

Adoption effort goes where the data says it is needed.

Repeatable refresh and reporting cadence

You get a refresh and reporting cadence that keeps the evidence current without manual work.

Evidence for scale decisions and investment

Licence and scale decisions rest on measured results from your own users.

Ideal for

Copilot and Teams
rollouts at scale

Best suited to large rollouts where adoption needs to be measured clearly.

Behaviour change
 programmes

Useful when change progress needs to be measured, understood and improved.

Data-backed 
scale decisions

Helps leaders decide where to invest, scale or adjust based on evidence.
Why CloudWay

CloudWay brings the same MVP-led, knowledge-transfer approach to data and analytics: Power BI and Microsoft Fabric foundations designed so your own team can maintain and extend them. CloudWay AS is based in Norway and works with organisations across Europe; see the customer stories page for the approach in practice. 

Ready to improve how your teams work?

Start with a focused workshop to identify priorities and align your organisation.

  • This field is hidden when viewing the form
  • This field is hidden when viewing the form
  • By clicking "Submit," you approve that CloudWay can contact you via email. Read our Privacy Policy.
  • This field is hidden when viewing the form
Digital Wellbeing Speaker - Ståle
Scroll to Top