
Power BI & Fabric Value Discovery

Get clarity on what to build first so analytics becomes decision-ready, not just more reports

More reports rarely fix reporting. CloudWay’s 1 to 2 week Value Discovery maps your priority business questions to the data behind them, agrees the KPIs that matter, and delivers a prioritised backlog for the first decision-ready dashboards in Power BI and Microsoft Fabric. It is the entry point to our Data & Analytics services. 

Most discoveries continue into our Semantic Model & RLS Foundation, which builds what the backlog calls for. 

The challenge

When teams cannot rely on reporting, decisions slow down and effort shifts from action to argument. The usual reaction is to build more reports, which makes it worse: more dashboards, more definitions, less trust. The fix starts before the first report, with agreeing which questions the business actually needs answered.

Slow reporting cycles

Reporting takes too long, delaying the decisions teams need to make.

Inconsistent numbers

Different reports and definitions make it harder to agree on what matters.

Low trust in metrics

Teams question the numbers, instead of using them to guide action.
What we do

Through short workshops, CloudWay turns business questions into a focused analytics plan. We map your priority questions to the data sources behind them, including the gaps, define the KPIs that drive decisions, and prioritise the first set of dashboards and reports. You leave with a practical backlog and roadmap, so analytics investment goes where it changes decisions. 

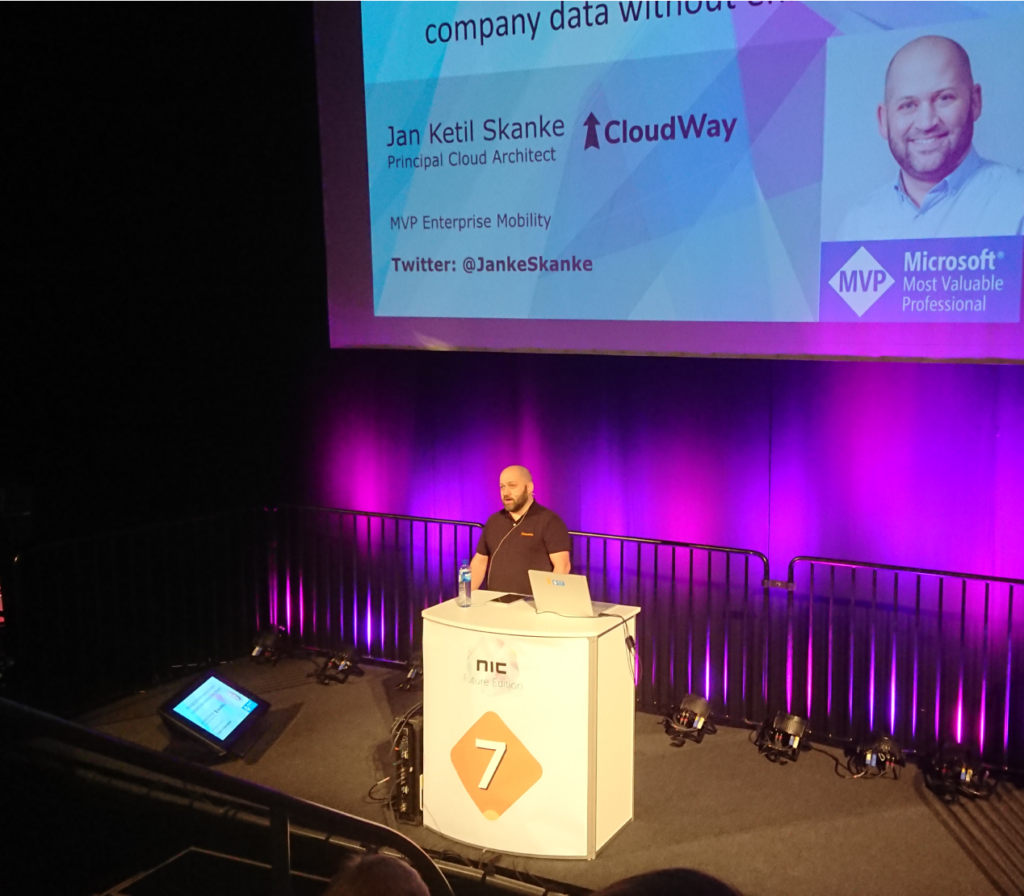
podium speaker
Step 1

Map the questions

Connect priority business questions to the data sources behind them.

Step 2

Define key KPIs

Agree on the metrics that matter most for decisions and performance.

Step 3

Prioritise first reports

Identify the first dashboards and reports that should be built.

Step 4

Shape the roadmap

Create a practical backlog so investment goes where it changes decisions.

You get

Typical outcomes

Prioritised analytics use cases

You get a ranked list of analytics use cases scored on decision impact and feasibility, so the first thing you build is the thing worth building.

Faster decisions with agreed KPIs

Discussions start from agreed numbers instead of competing spreadsheets.

Data/source map and gaps list

You get a map of your data sources against your priority questions, including where the data does not yet exist.

Less manual reporting and rework

Effort shifts from assembling reports to acting on them.

First-report backlog and roadmap

You get a backlog and roadmap for the first dashboards, ready to hand to whoever builds them.

Increased trust in metrics and reporting

People stop double-checking the dashboard against their own extract.

Ideal for

Leaders planning analytics investment

For leaders who need confidence on what to build first and where to focus effort.

Organisations with too many reports

Useful when reporting exists, but trust, adoption or consistency is still low.

Teams aligning data priorities

Helps teams connect analytics work to the business priorities that matter most.
Why CloudWay

CloudWay brings the same MVP-led, knowledge-transfer approach to data and analytics: Power BI and Microsoft Fabric foundations designed so your own team can maintain and extend them. CloudWay AS is based in Norway and works with organisations across Europe; see the customer stories page for the approach in practice. 

Ready to improve how your teams work?

Start with a focused workshop to identify priorities and align your organisation.

  • This field is hidden when viewing the form
  • This field is hidden when viewing the form
  • By clicking "Submit," you approve that CloudWay can contact you via email. Read our Privacy Policy.
  • This field is hidden when viewing the form
Digital Wellbeing Speaker - Ståle
Scroll to Top